
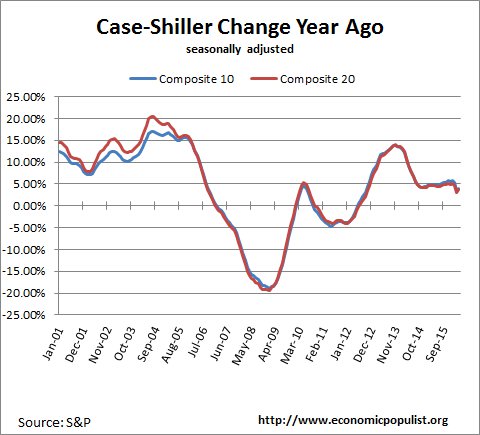
The February 2016 S&P Case Shiller home price index shows a seasonally adjusted 5.4% price increase from a year ago for the 20 metropolitan housing markets and a 4.6% yearly price increase in the top 10 housing markets. Home prices are still climbing over double the rate of inflation, although this is a slower pace than last month. The U.S. National Home Price Index increased 0.4% from January to February, seasonally adjusted. For the year, the national index has increased 5.3%. Since the price low of March 2012, the 10-City composite index has increased 34.95and the 20-City composite index has increased 36.3%. Average home prices are also back to their Winter 2007 levels.
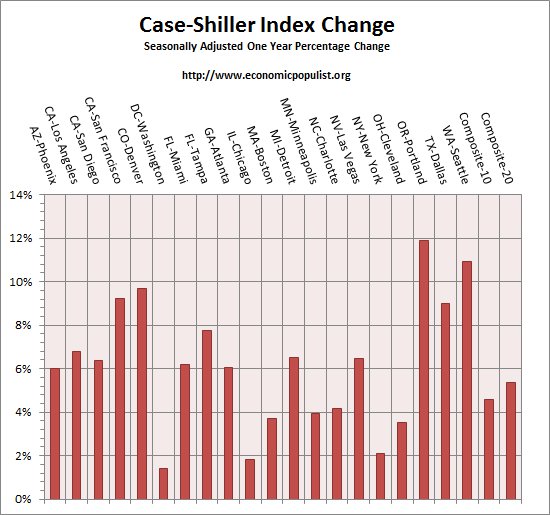
Below are all of the composite-20 index cities yearly price percentage change, using the seasonally adjusted data. The Northwest is on fire with Portland Oregon home prices increasing 11.9% and Seattle, Washington prices also above 10% in annual increase. San Francisco California and Denver Colorado prices increased over 9% from a year ago. Dallas Texas homes have also increased 9% in a year.. No composite-10 or composite-20 annual price gains are negative using the seasonally adjusted data and only two housing markets in the composite 20 were below 2% annual gains, Washington DC and Chicago Illinois. This is so unattainable for most people.
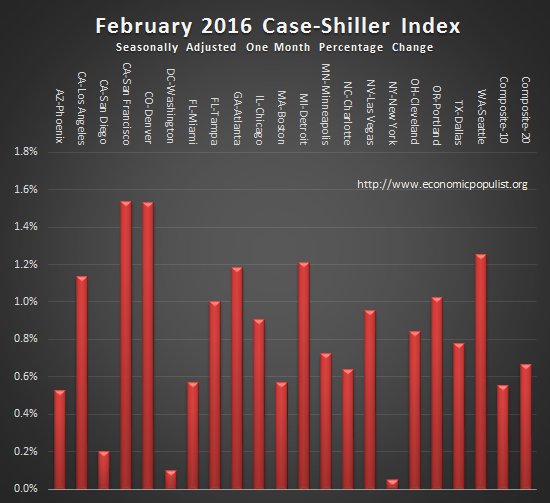
S&P reports the not seasonally adjusted data for their headlines, while this overview uses their seasonally adjusted metrics. For the month, the not seasonally adjusted composite-20 percentage change was 0.2% whereas the seasonally adjusted change for the composite-20 was 0.7%. The not seasonally adjusted composite-10 increased 0.1% from the previous month, whereas the seasonally adjusted composite-10 showed a 0.6% increase. The below graph shows the seasonally adjusted monthly percentage change. Housing is highly cyclical. Spring and early Summer are when most sales occur.
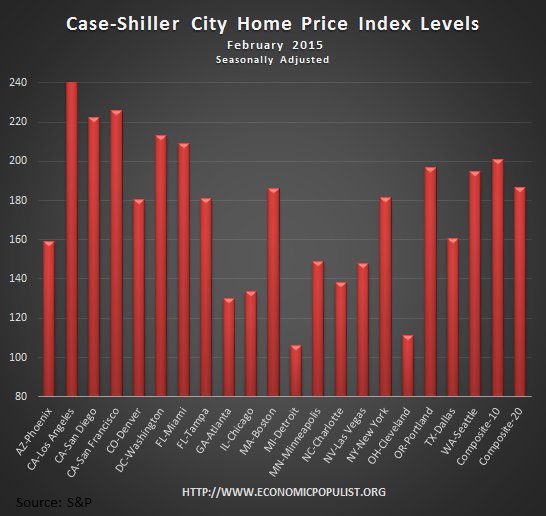
Case-shiller home price indices are normalized to the year 2000. The index value of 150 means single family housing prices have appreciated, or increased 50% since 2000 in that particular region. Case-Shiller indices are not adjusted for inflation. Below are the seasonally adjusted levels for the month.
S&P publishes a national index for home prices which has increased 5.3% for the year and 0.4% for the month. The same increases were true using seasonally adjusted values. S&P also commented on the very tight inventories in many sections of the county causing prices to increase in part. They also state the mortgage default rate is at a 2004 year low. IN 2009, the default rate was above 5%.
The mortgage default rate continues to mirror the path of home prices. Currently, the default rate on first mortgages is about three-quarters of one percent, a touch lower than in 2004. Moreover, the figure has drifted down in the last two years. While financing is not an issue for home buyers, rising prices are a concern in many parts of the country.
What we see with this latest report is the same ole, same ole. Statistics show great news for homeowners while those trying to build equity, ownership, have a harder and harder time as prices rise. While S&P states homes have increased at a slower pace, the Northwest now looks like a war zone of a housing crisis, the same as the Bay Area in California.
For more Information:
S&P does a great job of making the Case-Shiller data and details available for further information and analysis on their website.
Here is our Case-Shiller past overviews as well as the overviews of residential real estate statistics.
Recent comments