
The Conference Board LEI (leading economic indicator), dropped -0.1% for April.
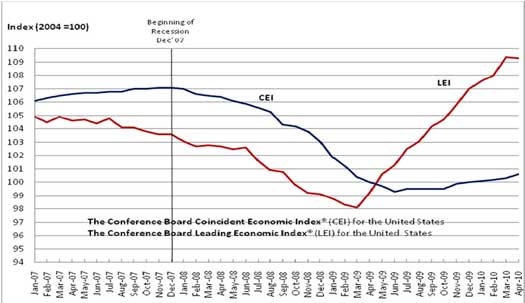
- LEI: -0.1%
- CEI: +0.2%
- LAG: +0.1%
Four of the ten indicators that make up The Conference Board LEI for the U.S. increased in April. The positive contributors – beginning with the largest positive contributor – were the interest rate spread, stock prices, average weekly manufacturing hours, and manufacturers’ new orders for nondefense capital goods*. The negative contributors – beginning with the largest negative contributor – were building permits, index of supplier deliveries (vendor performance), real money supply*, average weekly initial claims for unemployment insurance (inverted), the index of consumer expectations, and manufacturers’ new orders for consumer goods
and materials*.
Here are the components, along with their weights, which make up the LEI:
- Average weekly hours, manufacturing, 0.2725
- Average weekly initial claims for unemployment insurance, 0.0322
- Manufacturers' new orders, consumer goods and materials, 0.0809
- Index of supplier deliveries – vendor performance, 0.0715
- Manufacturers' new orders, nondefense capital goods, 0.0192
- Building permits, new private housing units, 0.0263
- Stock prices, 500 common stocks, 0.0373
- Money supply, M2, 0.3248
- Interest rate spread, 10-year Treasury bonds less federal funds, 0.1058
- Index of consumer expectations, 0.0295
So, a drop should be no real surprise to readers of this site, for we have graphed out (thanks to the St. Louis Federal Reserve FRED system), many of these economic indicators from their monthly reports. The rate of growth in manufacturing new orders has slowed, but more interesting is the weight above when manufacturing is now about 8-12% of the overall economy.
CEI is co-incident indicators and includes things such as personal income, industrial production and current unemployment rate. LAG means lagging economic indicators and includes the duration of unemployment.
Yesterday the FOMC raised GDP and employment estimates for 2010, 2011.
They are:
GDP to grow by a real 3.2% to 3.7% this year -- up from 2.8% to 3.5% in the January forecast. They expect real GDP growth of 3.4% to 4.5% next year and 3.5% to 4.5% in 2012. The "longer run" growth projection was unchanged at 2.5% to 2.8%.
They expect the unemployment rate to end the year between 9.1% and 9.5 percent -- down from January's 9.5% to 9.7% forecast and down from the current 9.9%. The project unemployment between 8.1% and 8.5% next year; 6.6% to 7.5% in 2011
Recent comments