
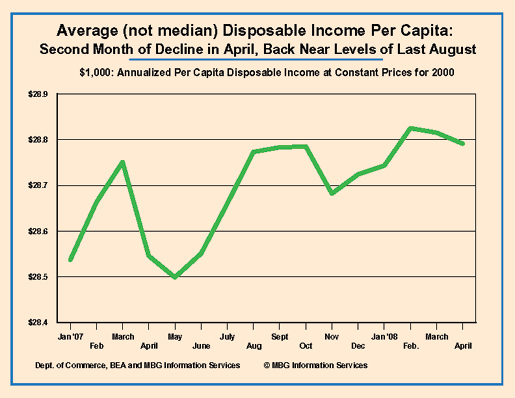
Average (not median) inflation-adjusted incomes and spending declined in April as average per capita disposable incomes fell back to levels of last summer.
Today’s BEA report on personal incomes for April shows that total PRICE ADJUSTED incomes fell -0.1% as sharp declines in total real compensation of -0.4% and real proprietor’s incomes of -0.3% were only partially offset by a remarkable spike in real rental income, up 12.7%, and government unemployment insurance payments, up 3.7%.
Beware analysts, media and politicians that (still!) ignore the effects of inflation on incomes and spending. Prices rose 0.23% in April.
Total personal taxes paid were less in April than in March so total real after-tax disposable incomes were down only very slightly. But because of population growth, real disposable income per capita declined another -0.1% in April, after also declining in March, now back to price-adjusted levels almost unchanged from last August. And remember: these are AVERAGE income data that include hedge fund geniuses – real median incomes and incomes of most people have almost certainly fallen much faster and much farther.
Total price-adjusted consumer spending also declined very slightly in April and by -0.1% on an average per capita basis. Separate from “consumer” spending, it is important to note that real, non-mortgage interest payments jumped 2.0% in April – ending six months of decline. This sharp jump in non-mortgage interest payments pushed total real outlays up slightly.
Today’s BEA report does not detail monthly household spending but remember that yesterday’s BEA report showed that ALL of the increase in real consumer spending January to March, was for additional medical care and maintenance/operation of existing homes. This pattern likely continued and perhaps accelerated in April. And, again, remember these data are for TOTAL spending; the bottom 80% of the income distribution has almost certainly focused on far more on essentials than has the top 20%.
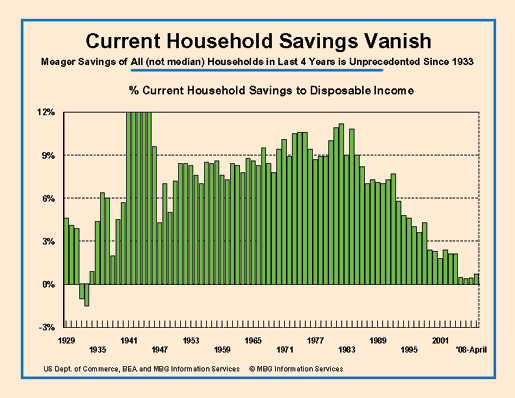
Finally, today’s report shows that with real incomes and consumer spending both declining slightly, the household savings rate remained at 0.7% in April, the same rate as in February and March. But a closer look at the data shows that total savings and the savings rate declined slightly in April reversing a four-month trend of improvement. That is, after the savings rate as a share of total disposable incomes fell to -0.10% last November, it improved to 0.21%, 0.26%, 0.74% and 0.75% in December, January, February and March, respectively.
Today’s report is more evidence of fierce financial pressures on households and suggests that current economic stagnation is unlikely to improve any time soon.
Comments
Are these numbers Real?
Are these numbers real, or are they still the fake numbers the US government has been using since the 1980s to figure inflation that ignore the cost of owning a house, fueling your car, or buying food?
-------------------------------------
Maximum jobs, not maximum profits.
they are real
but they are the raw data from the BLS analyzed by McMillion. He's a well known economist and enter the no spin zone.