
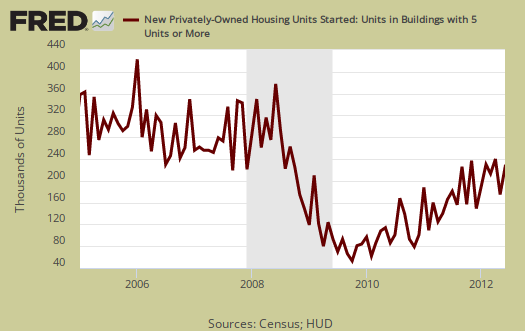
The June 2012 Residential construction report showed Housing starts increased, +6.9%, from May's revised 711,000, to a level of 760,000. In May, housing starts decreased -4.8%. Housing starts are above 23.6% from a year ago, outside the ±16.8% margin of error. Single family housing starts increased +4.7%. Apartments, 5 units or more of one building structure, increased 17.0%, but don't get too excited, this monthly percentage change has a whopping ±45.6% error margin. While this is the highest level of housing starts since late 2008, don't go Wall Street gaga, the housing bubble deflation was in full swing by that time. Additionally home construction has massive error margins.
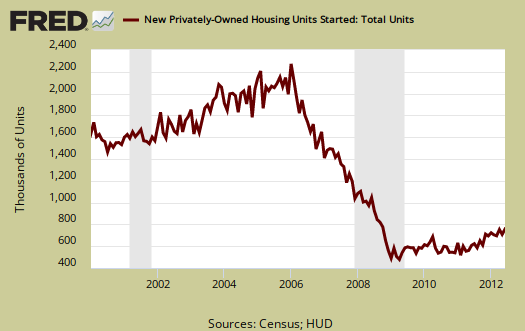
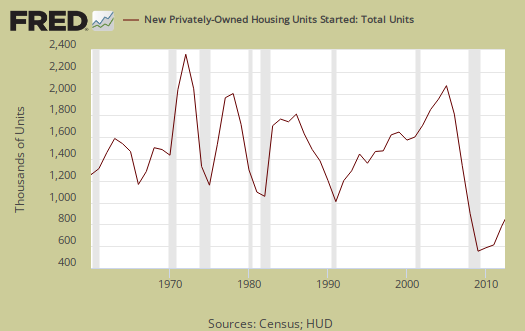
Housing starts are defined as when construction has broke ground, or started the excavation. One can see how badly the bubble burst on residential real estate in the below housing start graph going back all the way to 1960.
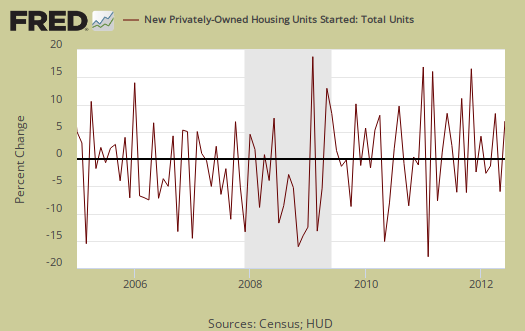
New Residential Construction has a margin of error way above the monthly percentage increases. This month has a error margin of ±13.3% percentage points on housing starts and a ±10.1% error margin for single family housing starts. Below is the monthly change so one can see the wild fluctuations. That's why one should not get too excited on the monthly percentage change.
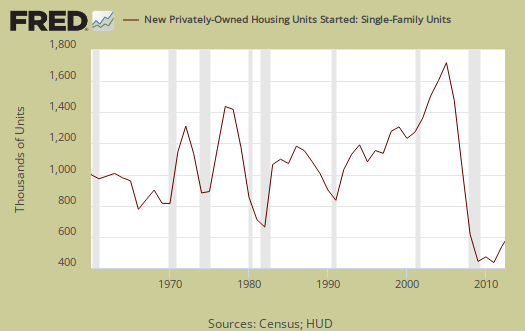
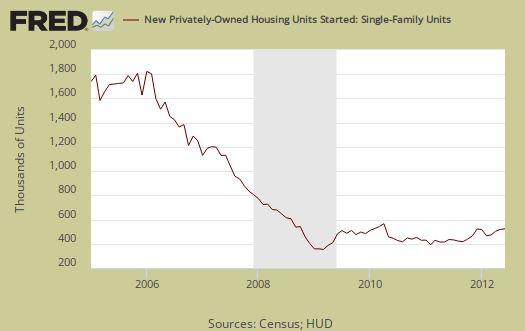
Single family housing is 75% of all residential housing starts. Below is the yearly graph of single family housing starts going back to 1960.
Housing of 5 or more units, or apartments, has increased 29.1% from a year ago, but here again, the margin of error is ±45.4%. That's almost a crap shoot in terms of accuracy.
Building permits decreased -3.7% to 755,000 and are up 19.3% from this time last year. The monthly change for building permits has a ±1.0% margin of error. In other words, building permits are much more accurate. Single family building permits increased 0.6% from last month. Below is the St. Louis Federal Reserve FRED graph for Building permits. The graph shows building permits are not always a smooth line from month to month. Building permits are local jurisdictions giving approval, or authority to build.

Housing Completions increased +2.6% and are now up +7.2%, from a year ago. Housing completions also have a large error margin, with a monthly error range of ±12.5%. Housing completions mean either people have moved in or the carpet is laid done. In other words the house is done, including the flooring.
This report has a large variance, so to establish a trend line one must take into account really a year of data. This report is also seasonally adjusted and residential real estate is highly seasonal. The statistics are also annualized, which gives what the levels would be if one month's rates were the same for the entire year.
Below is the graph of single family housing starts on a monthly basis.
So, watch out for Wall Street hype as well as vested interests in residential real estate on this report. While a good sign, one month of housing starts does not a magic major recovery make.
Recent comments