
The first quarter GDP initial estimate is a pathetically weak 0.7%. While the usual suspects, changes in private inventories, imports and government spending all contracted, the real drama is in the very weak consumer spending growth. Consumer spending is most of GDP and only gained a paltry 0.3% for Q1. Generally speaking, Q1 GDP's showing is pathetic, yet fear not, there are two revisions before the final and very often the revisions are not nearly as bad as the initial report. Q4 GDP was 2.1% by comparison.
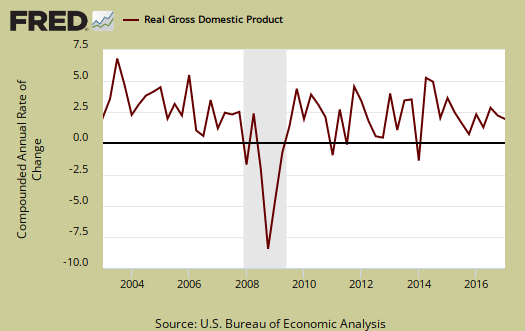
As a reminder, GDP is made up of: where Y=GDP, C=Consumption, I=Investment, G=Government Spending, (X-M)=Net Exports, X=Exports, M=Imports*. GDP in this overview, unless explicitly stated otherwise, refers to real GDP. Real GDP is in chained 2009 dollars.
The below table shows the GDP component comparison in percentage point spread from Q1 2017 to Q4 2016. There are always two revisions after the initial quarterly GDP report release. Trade data especially is revised, so expect imports and export figures to change.
| Comparison of Q1 2017 and Q4 2016 GDP Components | |||
|---|---|---|---|
|
Component |
Q1 2017 |
Q4 2016 |
Spread |
| GDP | +0.69. | +2.08 | -1.39 |
| C | +0.23 | +2.40 | --2.17 |
| I | +0.69 | +1.47 | -0.78 |
| G | -0.30 | +0.03 | -0.33 |
| X | +0.68 | -0.55 | +1.23 |
| M | -0.61 | -1.27 | +0.66 |
Consumer spending, C was really weak. only a 0.23 percentage point contribution to Q1 GDP. Below is a percentage change graph in real consumer spending going back to 2005 and one can see this is quite a bad quarter.
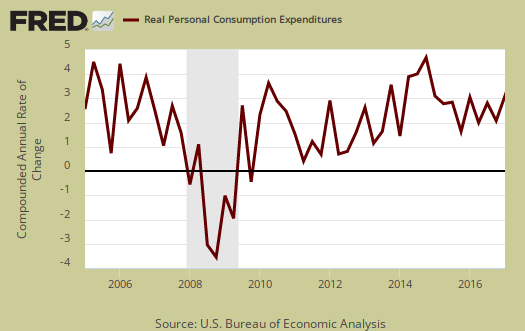
Consumer spending is also known as personal consumption expenditures. It is made up of spending on goods and services in the U.S. Goods expenditures GDP contribution was awful, a mere 0.02 percentage points. Motor vehicles and parts shaved off -0.45 percentage points of GDP and are part of durable goods. Nondurable goods was a 0.22 percentage point contribution. Services spending showed a 0.21 GDP percentage point contribution. Within services, health care was a 0.37 percentage point contribution to GDP, and every quarter, America is clearly spending a lot of their money on health care. Housing and utilities was negative, -0.29 percentage points. Graphed below is PCE with the quarterly annualized percentage change breakdown of durable goods (red or bright red), nondurable goods (blue) versus services (maroon).

Imports and Exports, M & X trade data was a wash, with a net 0.07 percent point contribution. This is the advance GDP estimate, hence actual trade data hasn't come in yet and imports are almost always revised. Exports by themselves had a good showing with a 0.68 percentage point contribution. Alas, trade data goes both ways and imports subtracted -0.61 percentage points to GDP. The next revision release is next month.

Government spending, G in contrast to the political rhetoric, contributes to economic growth. It also can contract it as Q1 proved. Overall government spending subtracted -0.30 percentage points to Q1 GDP. National defense spending shaved off -0.16 GDP percentage points while state and local did their contraction part with a -0.17 percentage point GDP haircut. Government spending has been an absentee player since 2010 in GDP growth.

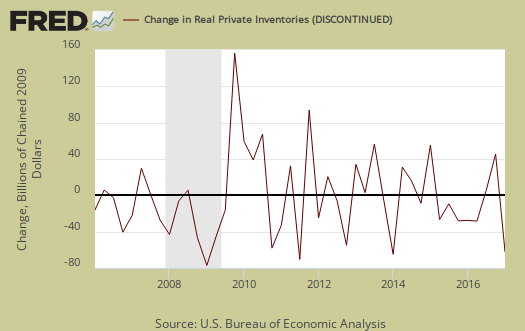
Investment, I is made up of fixed investment and changes to private inventories. Overall investment added 0.69 GDP percentage points and the reason is fixed investment. Fixed investment added 1.62 percentage points to Q1 GDP with nonresidential adding 1.12 percentage points. The change in private inventories alone is another story. Changes in private inventories hammered Q1 GDP by almost a percentage point, a -0.93 shellacking to GDP. Below are the change in real private inventories and the next graph is the change in that value from the previous quarter, one quarter does not an alarm make but half a year of accelerated inventory contraction would be very bad news indeed.

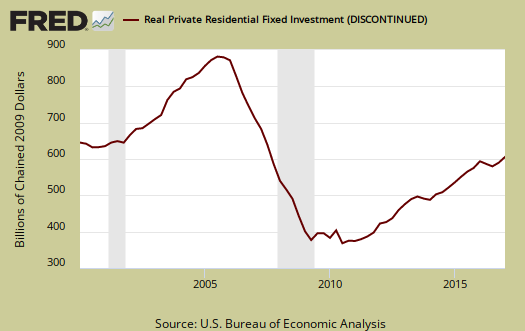
Fixed investment is residential and nonresidential. Within nonresidential, structures contributed 0.55 percentage points to GDP and equipment added 0.49 GDP percentage points.

Residential fixed investment was half a percentage point GDP contribution. GDP is real valued, so soaring housing prices are not part of this figure. The below graph shows residential fixed investment.
Nominal GDP: In current dollars, not adjusted for prices, of the U.S. output,was $19,007.3 billion, a 3.0% annualized increase from Q4 to Q1. In Q4, current dollar GDP increased 4.2%, showing even when inflation is not considered, Q1 is weaker.

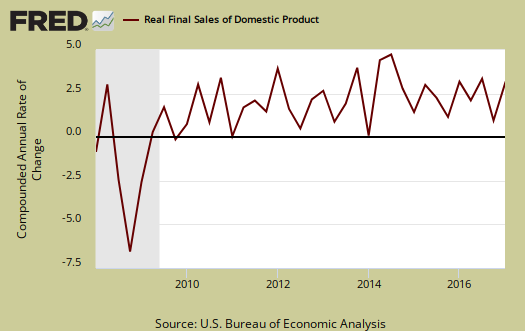
Real final sales of domestic product is GDP - inventories change. This figures gives a feel for real demand in the economy. This is because while private inventories represent economic activity, the stuff is sitting on the shelf, it's not demanded or sold. Real final sales increased 1.6%, which isn't that great, so once again validation that one cannot just blame changes in private inventories this quarter.
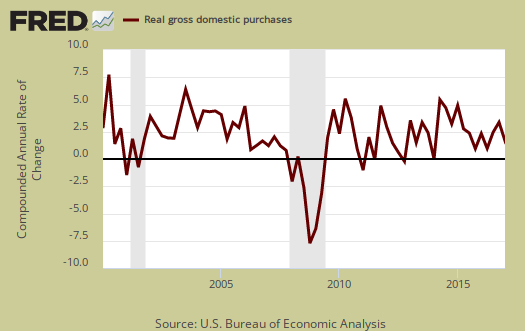
Gross domestic purchases are what U.S. consumers bought no matter whether it was made in Ohio or China. It's defined as GDP plus imports and minus exports or using our above equation: where P = Real gross domestic purchases. Real gross domestic purchases increased 0.6% in Q1. Exports are subtracted off because they are not available for purchase by Americans, but imports are available for purchase in the U.S. This poor showing also should be no surprise considering how imports wiped out any GDP contribution exports made. When gross domestic purchases exceed GDP, that's actually bad news, it means America is buying imports instead of goods made domestically.
The price index for gross domestic purchases increased 2.6% for Q1. The PCE price index was 2.0% for Q4 2016. Without food and energy considered, the core price index increased 2.0%. In Q4, without food and energy considered, was 1.3%. The Federal Reserve's target inflation rate is about 2.0% without food and energy considered.

Below are the percentage changes of the Q1 2017 GDP components, from Q4 2016. There is a difference between percentage change and percentage point change. Point change adds up to the total GDP percentage change and is reported above. The below is the individual quarterly percentage change, against themselves, of each component which makes up overall GDP. Additionally these changes are seasonally adjusted and reported by the BEA in annualized format. Durable goods by themselves showed a -2.5% decline. Structures within fixed investment showed a 22.1% increase from Q4. Residential investment showed a 13.7% quarterly decrease and has been on the rise for some time.
|
Q1 2017 GDP Component Percentage Change (annualized) |
|||
|---|---|---|---|
| Component | Percentage Change from Q4 2016 | ||
| GDP | +0.7% | ||
| C | +0.3% | ||
| I | +4.3% | ||
| G | -1.7% | ||
| X | +5.8% | ||
| M | +4.1% | ||
This GDP report is really bad but not due to changes in private inventories, instead weak consumer spending. The fact the trade deficit was a wash is almost a blessing these days. Once again the better news is one quarter does not a GDP make and the advance report is often revised beyond recognition to the initial release.
Other overviews on gross domestic product can be found here. The BEA GDP site is here.
Recent comments