The mantra for the October state employment statistics is little change from September. Over and over we see dropping unemployment rates yet too little significant growth in actual jobs. Only seven states had unemployment increases, six had no change and 35 plus the District of Columbia showed declines. Below is the BLS map of state's unemployment rates for October 2012.
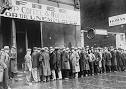
Ah, Turkey day. The time of family, good food, friends, football and shopping. Or, is that what we have been told to believe? With 15% of America on food stamps, the call to shopping seems a little insulting. Even being thankful seems disingenuous.
The DOL reported Initial weekly unemployment claims for the week ending on November 17th, 2012 were 410,000, a 41,000 drop from the previous week of 451,000. Superstorm Sandy's devastating effects can be seen in state not seasonally adjusted claims for the week of November 10th.
The October 2012 Residential construction report showed Housing starts increased, 3.6%, from September's revised 863,000, to a level of 894,000 Housing starts have increased +41.9% from a year ago, outside the ±15.9% margin of error. For the month, single family housing starts decreased -0.2%.
The loss of the Hostess Twinkie is a symbol of a new era for the American worker. Chemical cupcakes usher in the race to the economic bottom, where the new business operandi is the stripping of worker wages and benefits. Gone are middle class incomes and lifestyles for most. Here are temporary jobs, no benefits and assuredly no retirement. America has been sliced, and diced, just like Wonder Bread.
Hurricane Sandy wiped out almost a full percentage point of industrial production even though the storm hit New Jersey on October 29th. Twenty percent of industrial production activity is in counties affected by the storm and 3-4% of industrial production related employment is in the same areas. It matters where a Hurricane hits in terms of the economy.
The October Consumer Price Index increased 0.1% from September. CPI measures inflation, or price increases. This month the culprit isn't gas prices, the gasoline index declined by -0.6% after July through September's meteoric 16.6% rise. The problem is the cost to rent a place to live increased 0.4% and had the highest monthly jump since June 2008.
October 2012 Retail Sales decreased, by -0.3%, Autos & Parts alone dropped -1.5% while auto dealers, part of autos & parts sales, declined by -1.6%. Minus autos & parts, retail sales had no change from last month. September's monthly percentage change was revised upward, from 1.1% to 1.3%. Retail sales are reported by dollars, not by volume, so dropping prices often reports as a decline in sales.
The election was won by identity politics. Black people voted for President Obama by over 93%, Hispanics 71% and Asians 73%. The exit polls show 55% of women voted for Obama, whereas 59% of white people voted for Romney. Ninety percent who thought the economy is good voted for Obama. Those who thought it is not so good voted for Romney by 60% margins.
Why Romney lost so big is a topic really outside our purview, yet we'll put in our 2¢ that it might be due to campaign rhetoric on policies promised. Unfortunately, there are words and there are deeds. What has the Obama administration done economically for the demographic groups who gave President Obama a second term?
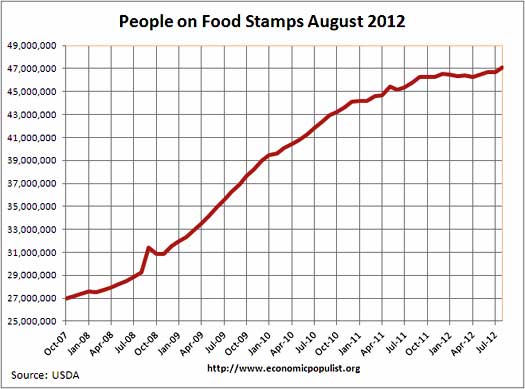
Food stamp usage has soared to a new record high of 47,102,780. As of August 2012, 1 in 6.7 people are on food stamps in the United States. That's 15.0% of people living in America are on food assistance. The United States population in middle of August 2012 was 314,484,000 and this figure includes everyone, including Americans overseas. Food stamp usage increased 2.9% from August 2011 and 0.9% from July 2012.
Since October 2007, food stamp usage has increased 74.4%. Population has increased 3.9% during the same time period. That is how badly America is hurting.

 Ah, Turkey day. The time of family, good food, friends, football and shopping. Or, is that what we have been told to believe? With
 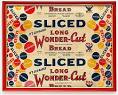 The loss of the Hostess Twinkie is a symbol of a new era for the American worker. Chemical cupcakes usher in the race to the economic bottom, where the new business operandi is the stripping of worker wages and benefits. Gone are middle class incomes and lifestyles for most. Here are temporary jobs, no benefits and assuredly no retirement. America has been sliced, and diced, just like Wonder Bread.
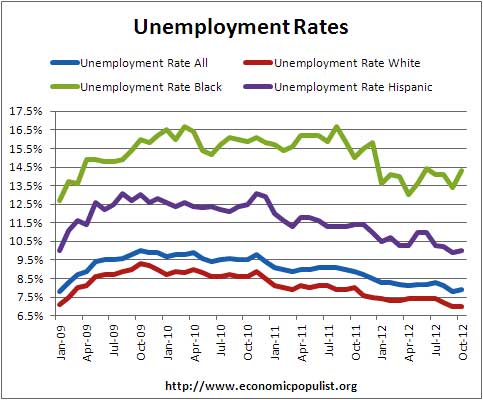
Recent comments